The Science of Metagaming
Metagaming is an approach to determine the tournament environment by examining past tournament results. A hypothesis proposes that tournaments having the same participant composition would produce different results. Testing are conducted by generating mock tournaments to examine and investigate the hypothesis.
1 Introduction
In preparation for an upcoming tournament, players would predict the metagame in order to fine tune their decks against their opponents. Analyzing past tournament results is a sound method to determine what decks, cards, and strategies are popular in the current metagame.
However, due to the limitations of the Swiss and Single-Elimination tournament system, the tournament results may deviate due to the pairings. The hypothesis proposes that tournament comprising of the same participant composition, with a significant amount of participants and thus a reasonably sufficient amount of tournament rounds being played, would produce different results from each other.
2 Methods
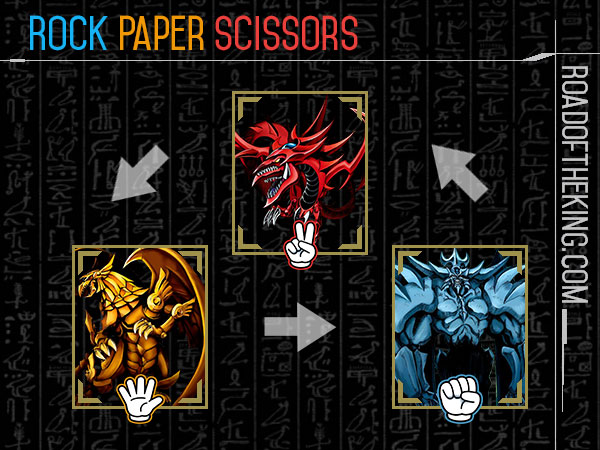
The metagame is made up of Rock, Paper and Scissors decks. Rock will always win against Scissors, Scissors will always win against Paper, and Paper will always win against Rock. In the mirror match, i.e. Rock against Rock, Paper against Paper, Scissors against Scissors, the winner will be randomly assigned. Hence each deck has exactly 50% win rate.
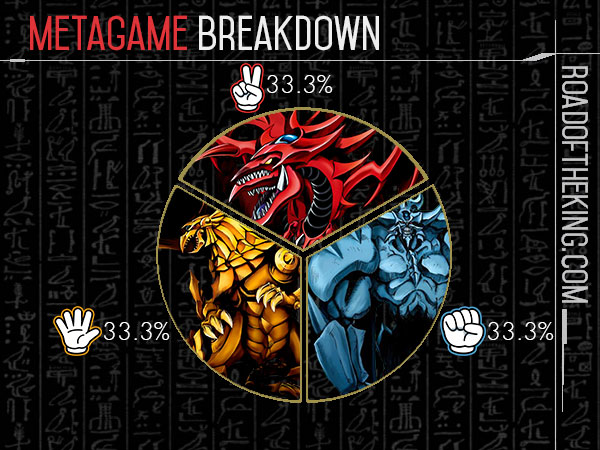
Each tournament is made up of 600 participants, comprising of 200 Rock decks, 200 Paper decks and 200 Scissors deck. The tournament format will be 8 rounds of Swiss follow by a top cut where the Top 64 players advance to Single-Elimination. Players are randomly paired using Konami Tournament Software (KTS). A total of 3 tournaments will be run.
3 Results
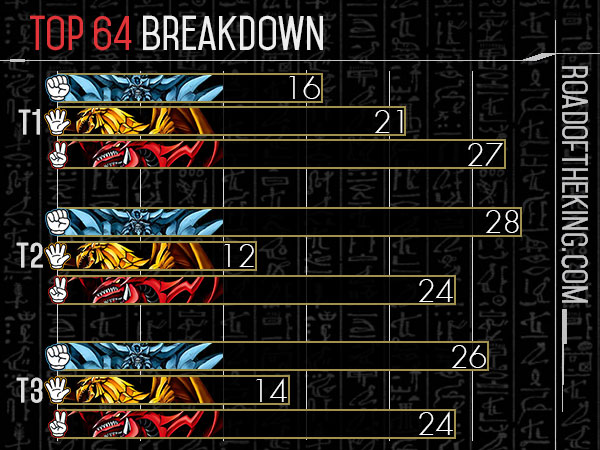
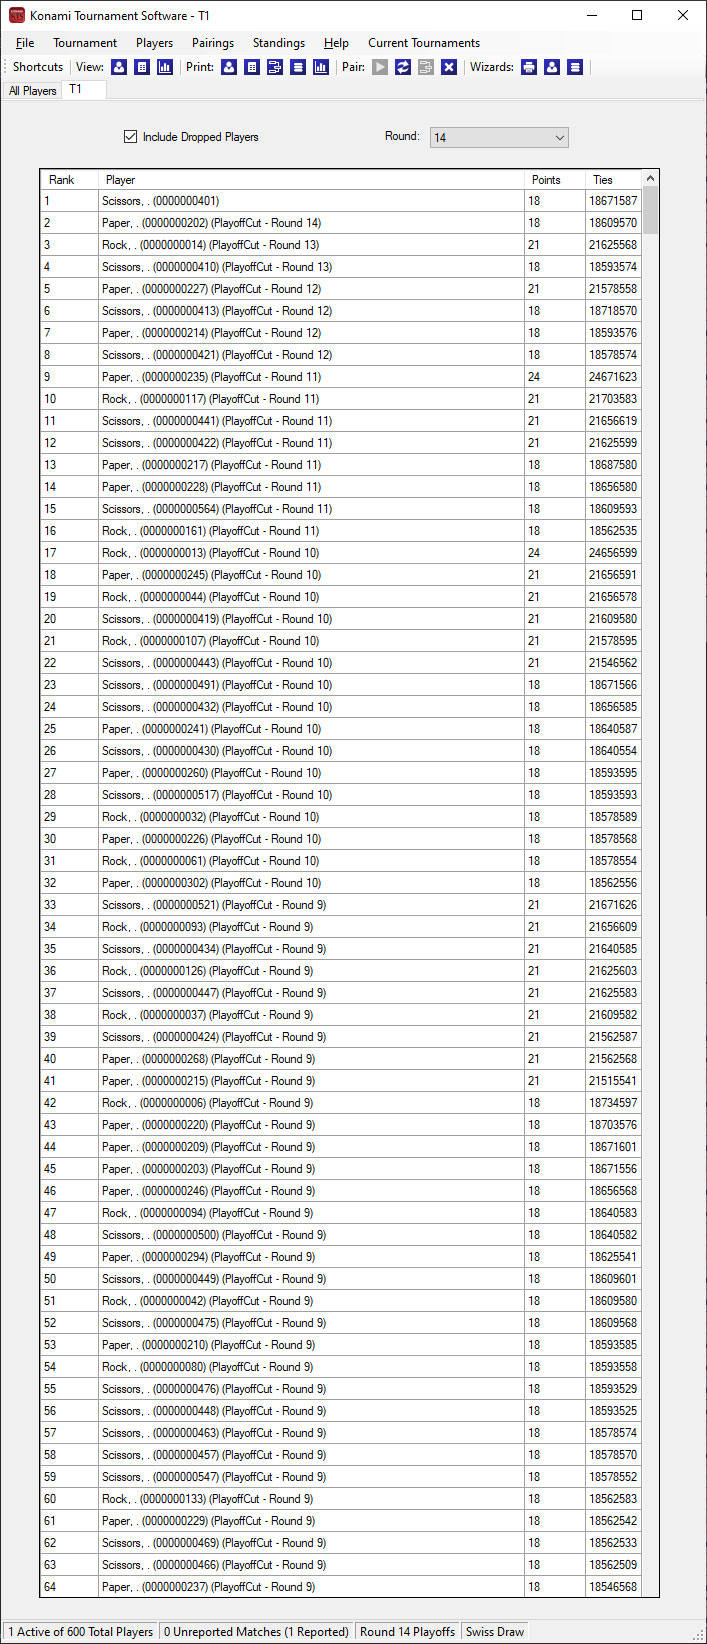
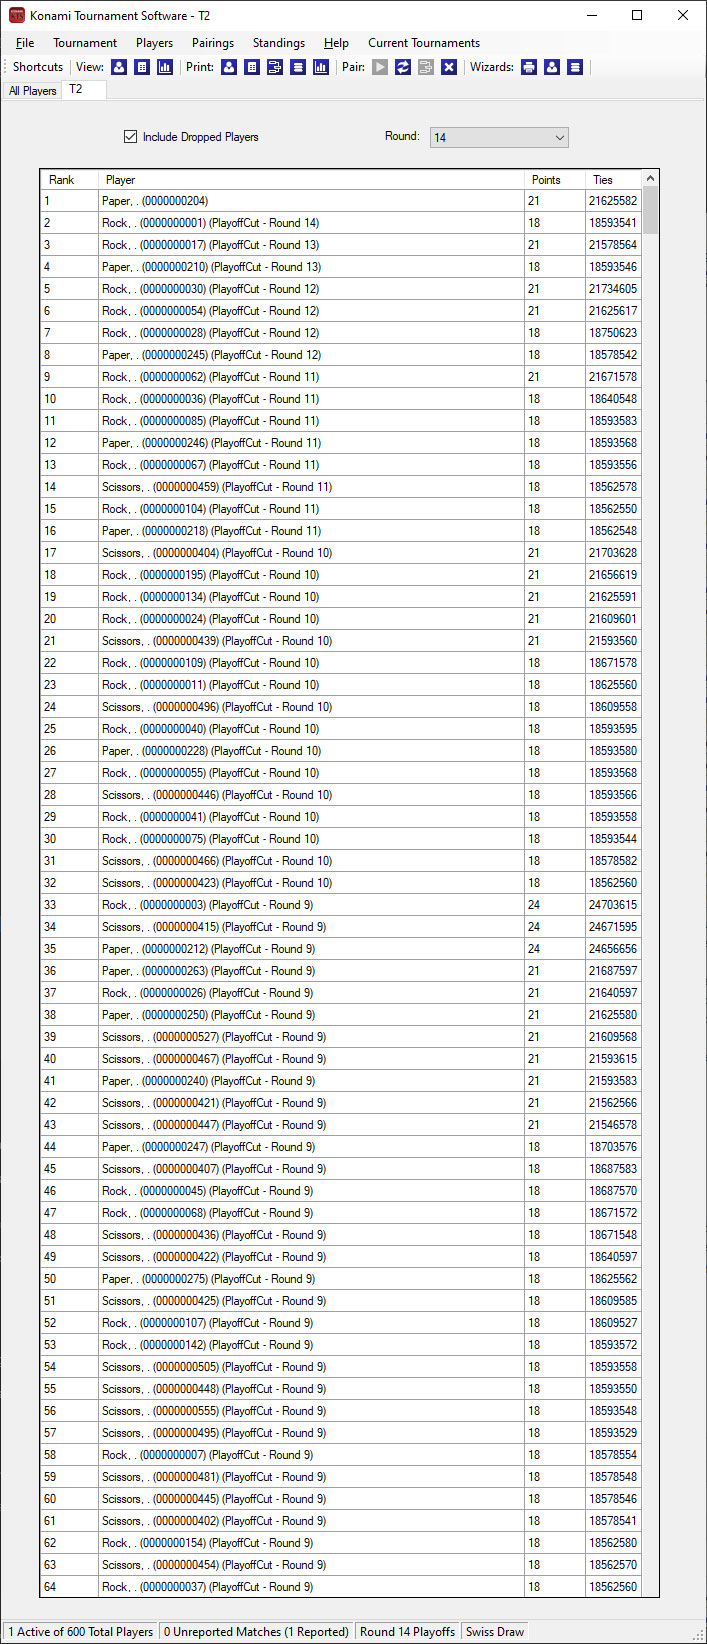
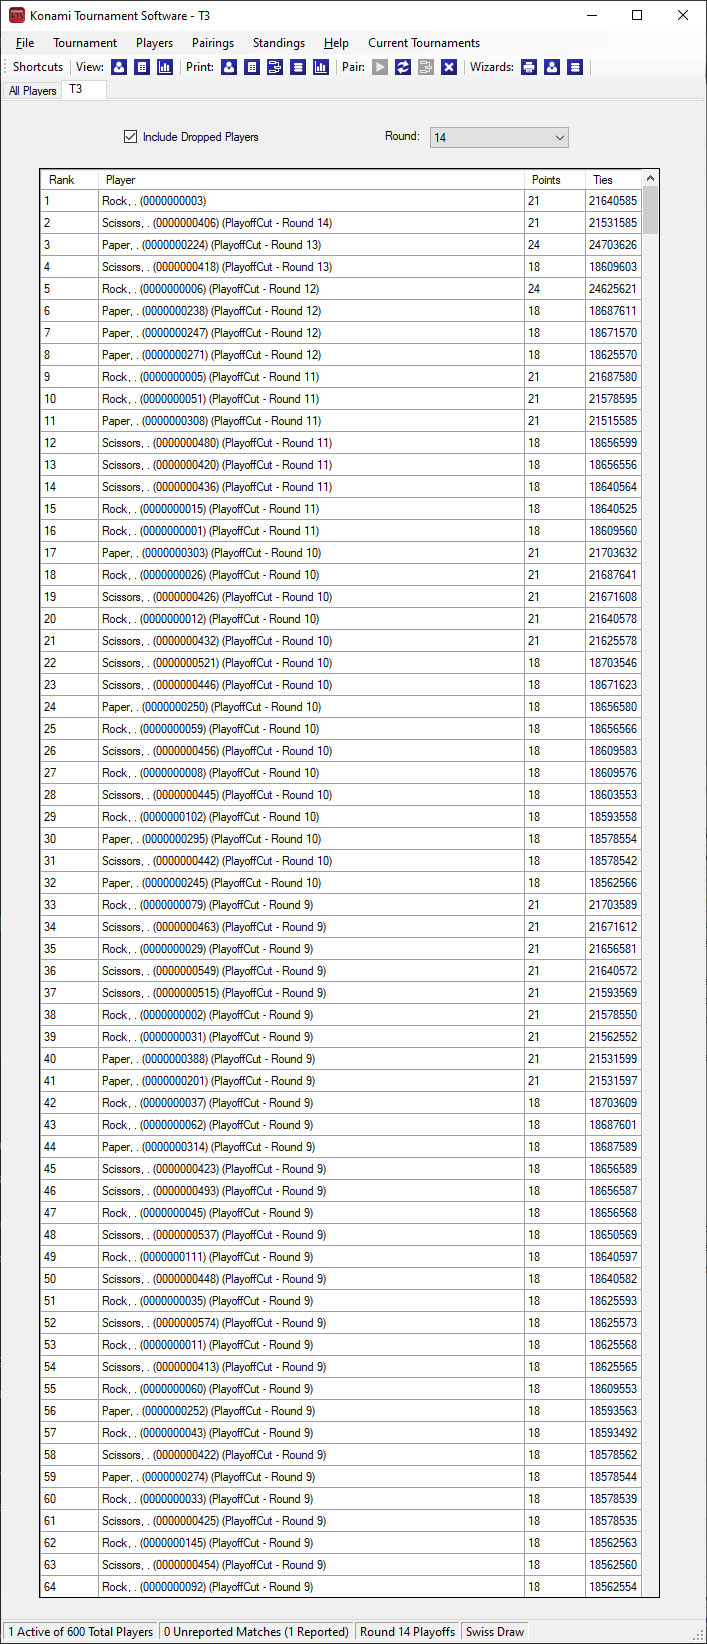
Each tournament started off with an even distribution of Rock, Paper and Scissors decks, but this distribution is not carried over to the top cut.
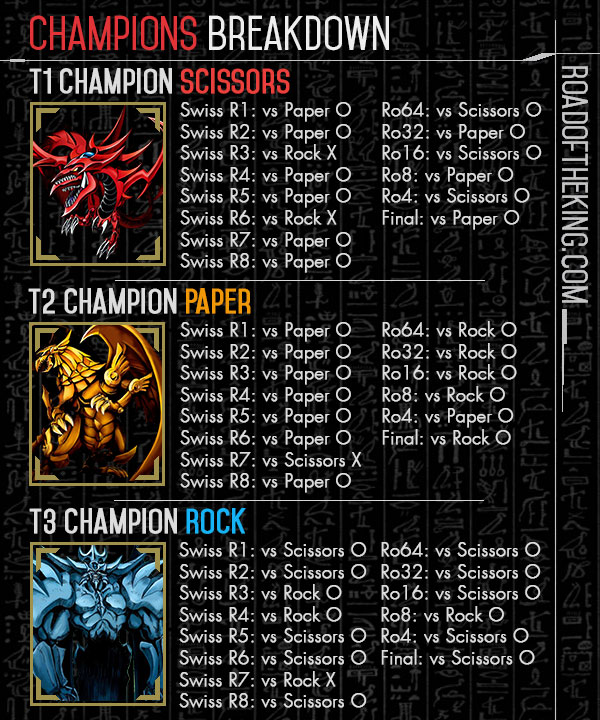
The champion of each tournament played against an uneven spread of opponents.
T1 Champion Scissors played against 2 Rock, 9 Paper and 3 Scissors.
T2 Champion Paper played against 5 Rock, 8 Paper and 1 Scissors.
T3 Champion Rock played against 4 Rock, 0 Paper and 10 Scissors.
4 Discussion
The 3 decks have the same 50% win rate, each has a 33.3% distribution in the tournament, hence the expected value of the top cut would be 64 / 3 = 21.3 for each deck. In all three tournaments, there are decks that underperformed and decks that overperformed. This is caused by the variance in the tournament pairings. In a 600 players tournament, the champion would only face up to 14 different opponents, and not all of the other 599 players.
Variance in pairings meant that each player would face an unequal amount of good match-ups and bad match-ups. The champions breakdown revealed that each of them faced very minimal bad match-up. In particular, the T3 Champion Rock did not face a single Paper opponent and had 0 bad match-ups for all 14 rounds.
Deck power level and their metagame share are not explicitly correlated. In a format where one or two decks have a significantly higher win rate than the rest, they would show up more consistently in the top cut, and thus take up a bigger share in the metagame breakdown. But in a format where the win rate across the decks are fairly even, the metagame breakdown across the tournaments would be quite varied.
To objectively determine the power level of a deck, the deck has to be pitted against other top decks in the metagame to calculate its actual win rate. According to Frank Karsten’s calculations, a sample size of approximately 400 games is required to achieve a margin of error of +/-5%, i.e. a 95% confidence interval no more than 0.10 units wide. In a balance and diverse metagame, the win rate difference between the top decks is usually no more than a few percent. A +/-5% margin of error is too wide to differentiate the power level accurately. To reduce the margin of error to +/-2%, i.e. a 95% confidence interval no more than 0.04 units wide, a sample size of approximately 2500 games is required. Assuming that we pick just the top 5 decks for our playtest, 5 C 2 = 10, 2500 × 10 = 25,000 games is required to calculate the win rates between these 5 decks. Playing 25,000 games is a well-nigh impossible task, especially with the rapidly shifting metagame.
This may also explain the difference in metagame trend and preference across the different regions in a balance metagame. Paper underperformed in T2 and T3 and that would lead to players in those regions to lean towards Rock. Whereas Rock underperformed in T1 and players of that region would lean towards Scissors instead. The truth is all 3 decks have the exact same power level at 50% win rate.
5 Conclusion
The hypothesis that tournaments having the same participant composition would produce different results stands correct. By increasing the amount of mock tournaments used in the experiment, the averaged data is likely to converge towards an even 33.3% spread across each of the 3 decks.
However, in practice, major tournaments with high participant counts are only held once a month on average. The metagame could have shifted in the period between two major tournaments, such as when you have two high impact booster packs Burst of Destiny and Deck Build Pack: Grand Creators that were released 6 weeks apart. In this case, it might be more accurate to analyze data from the local tournaments held just a week or two before the major tournament.
Rather than presenting the power level of the decks, the metagame breakdown is more about gauging the popular decks, cards, and strategies based on players’ preference and performance in various tournaments.
References
Frank Karsten (2018). Magic Math: How Many Games do You Need for Statistical Significance in Playtesting?, <https://strategy.channelfireball.com/all-strategy/mtg/channelmagic-articles/magic-math-how-many-games-do-you-need-for-statistical-significance-in-playtesting/>.
Appendix


Very insightful!!!!!!
Very good article, keep it up!